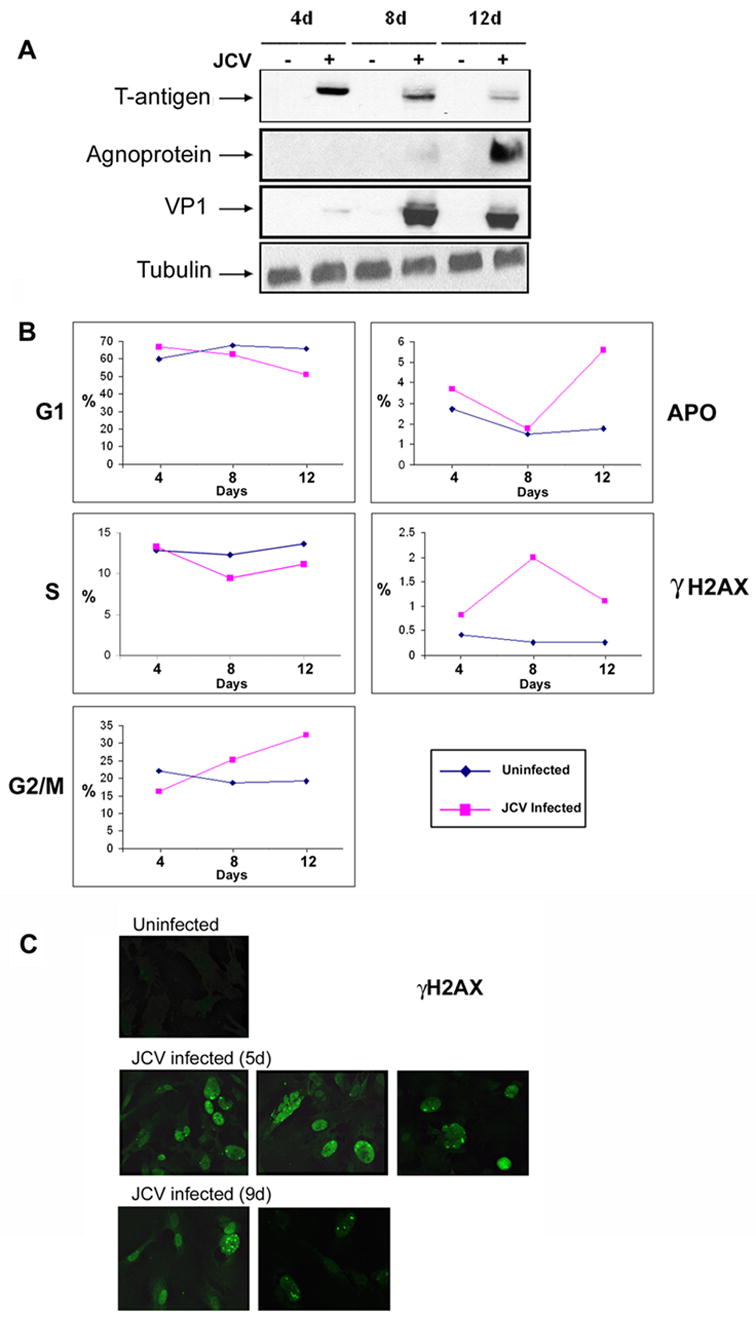
Figure 2. Flow cytometric analysis of cell cycle and γH2AX expression.

A. Cells were harvested from Mad-1/SVEdelta JCV-infected astrocytes and uninfected controls at 4, 8 and 12 days post-infection and stained with FITC-conjugated antibody to phospho-Histone H2AX (Ser139) and with propidium iodide and subject to flow cytometry analysis as described in Materials and Methods. The peaks corresponding to each of the different stages of the cell cycle are plotted against time with the subdiploid peak defined as the apoptotic peak (APO) and FITC fluorescence used to define the phosphorylation of histone H2AX (γH2A). B. Western blot of the cultures shown in Panel A to verify the expression of viral proteins during the course of infection. These experiments were conducted three times. C. Cells cultures from the 4 day and 8 day time points were replated on glass coverslips and analyzed by immunocytochemistry using an antibody specific for phospho-H2AX (anti-γH2AX) at days 5 and 9 after infection respectively.
