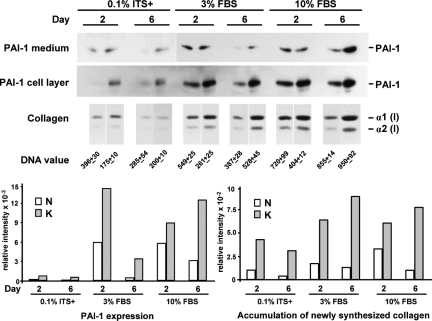
Figure 1.
Comparison of PAI-1 protein and accumulation of newly synthesized collagen between a pair of keloid (strain K-C3) and normal (strain N-M) fibroblasts best matched in donor age, ethnic background, and anatomical location (Table 1). Each protein band represents the physical pool of triplicate samples. Medium and cell layer fractions were analyzed separately for PAI-1 protein expression and combined for collagen accumulation. The images from 1-hour exposure of PAI-1 Western blots are presented for cell layer samples, and 10-minute images are presented for medium samples, except the 0.1% ITS samples (also 1 hour). Tritiated proline fluorographic images of pepsin-treated collagen after SDS-PAGE are presented for all collagen samples. DNA values (mean of triplicate samples ± SD) from parallel cultures were used for normalization of the relative intensities of PAI-1 and collagen [α1(I)] bands obtained by digital image analysis. PAI-1 values from the medium and cell layer were combined for the normalized bar graphs that summarize these results (bottom panel). PAI-1 = 47 kDa.

