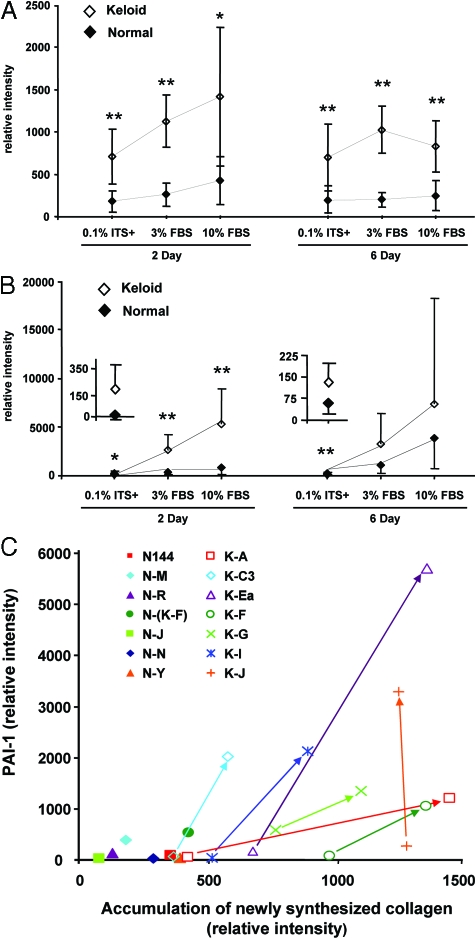
Figure 2.
Comparison of accumulation of newly synthesized collagen (A) and PAI-1 expression (B) between seven strains each of freshly isolated and low passage (≤2) keloid and normal fibroblast cultures. Fibroblasts were cultured in 0.1% ITS+, 3% FBS, or 10% FBS for 2 or 6 days. Triplicate samples were analyzed as a physical pool for each cell strain as described in the legend to Figure 1. The relative intensities of PAI-1 and collagen [α1(I)] bands from both the medium and cell layer were quantified by digital image analysis and normalized with cellular DNA content. Digital image analysis was based on pairwise determination of band intensity from multiple film exposures. Samples common to each pair of gels were included to enable comparison between gels in the same experiment and between gels of all cell strains. Each point represents the mean ± SD from seven strains each of normal or keloid fibroblasts and includes the strains analyzed in Figure 1. ⋄, Keloid fibroblasts; ♦, normal fibroblasts. Insets contain a magnified scale for data points from normal and keloid fibroblasts cultured in 0.1% ITS+. *P ≤ 0.05; **P ≤ 0.01. Plots of strain-specific data are presented as a supplement (Supplemental Figure S1, A and B). C: A combined plot of PAI-1 and collagen strain-specific data for normal and keloid fibroblasts analyzed on day 2 after culture in ITS+ or 3% FBS. For each keloid strain, the data point for culture in ITS+ is connected to that in 3% FBS by an arrow originating at the ITS+ point. The angled arrows indicate simultaneous increases in both the PAI-1 and collagen parameters. Because all data from normal strains in ITS+ fell closer to the origin than the corresponding data from normal strains in 3% FBS, only the data from the more stimulatory 3% FBS culture of normal cells are presented. Normal fibroblast strains, filled symbols; keloid fibroblast strains, open symbols, +, ×, and *. Strain identifiers are presented in the legend and in Table 1.

