Figure 3.
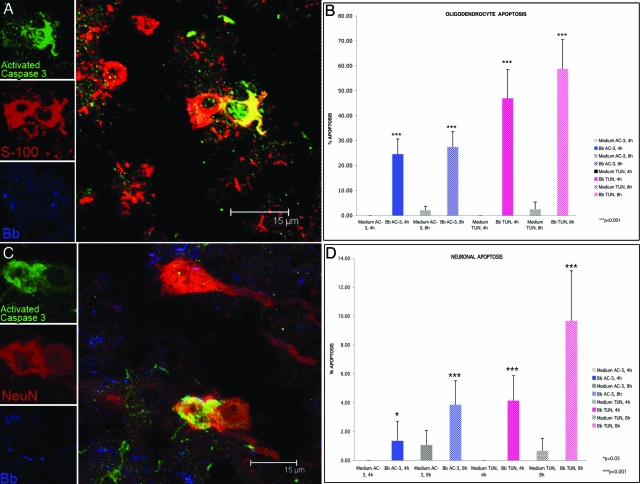
Oligodendrocyte and neuronal apoptosis in frontal cortex brain tissue exposed to live B. burgdorferi. A: Confocal micrograph showing apoptotic oligodendrocytes as yellow because of co-localization of antibody to active caspase-3 (green) and antibody to S-100 antigen (red). Spirochetes in this section appear blue. B: Percentage of oligodendrocytes (S-100-positive, GFAP-negative) undergoing apoptosis after 4 hours and 8 hours of exposure to live B. burgdorferi as quantified by both the active caspase-3 (AC-3) and in situ TUNEL assays (TUN). C: Confocal micrograph showing apoptotic neurons as yellow because of co-localization of antibody to active caspase-3 (green) and antibody to the neuronal marker NeuN (red). Spirochetes appear blue in color. D: Percentage of neurons undergoing apoptosis after 4 hours and 8 hours of exposure to live B. burgdorferi as quantified by both the active caspase-3 (AC-3) and in situ TUNEL assays (TUN).

