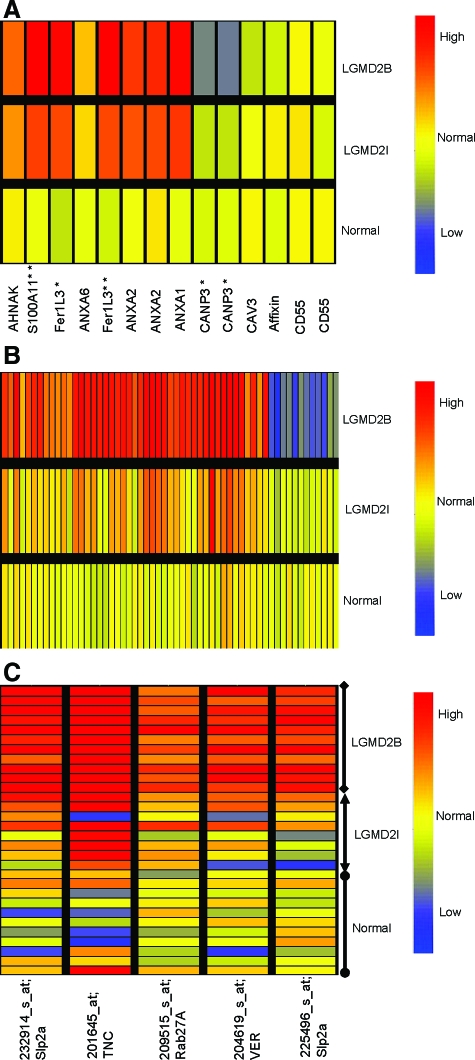
Figure 1.
mRNA Profiling Identifies both Pathology-Associated and Dysferlin-Specific Transcription Changes. A: Shown is relative expression of transcripts previously reported to be associated with dysferlin-deficiency.22,23,24,25 Signals (PLIER) from patients muscle biopsies were averaged, and normal volunteer muscle (Normal; n = 11), FKRP muscle (LGMD2I; n = 9), and Dysferlin-deficient (LGMD2B; n = 10). Some transcripts showed multiple probe sets against the full-length transcript, and in these cases results for both probe sets are shown (ANXA2 [annexin 2], CANP3 [calpain 3], CD55 [DAF]). Most transcripts (7/10 genes) showed similar expression pattern in FKRP and dysferlin-deficient patient biopsies. Myoferlin [Fer1L3], and S100A11 were increased in both FKRP and dysferlin deficiency, although increases were higher in dysferlin (*P < 0.05; **P < 0.01). Calpain 3 mRNA was specifically reduced in dysferlin-deficient muscle, as previously reported (*P < 0.05).33 Red color indicates increased expression of the mRNA, while blue indicates decreased expression. B: Shown are statistically significant altered transcripts specific for dysferlin-deficiency (Welch analysis of variance P < 0.005). Signals (PLIER) from patients muscle biopsies were averaged and represented. Fifty-eight differentially expressed genes specific for dysferlin deficient group were observed (see Table 2 for P values and fold changes). C: Shown are signals for the transcripts specific to dysferlin-deficient muscle that were validated by protein studies. Multiple probe sets for Slp2a are shown, and each individual patient signal represented separately. Transcripts for an alternative vesicle trafficking pathway, Synaptotagmin-like protein (Slp2a) and a small GTPase (Rab27A) were significantly higher in all dysferlin deficient patients. Two inflammatory proteins, tenascin (TNC) and versican (VER) were found highly expressed in dysferlin-deficient muscle sample at mRNA level compared with FKRP and normal samples.

