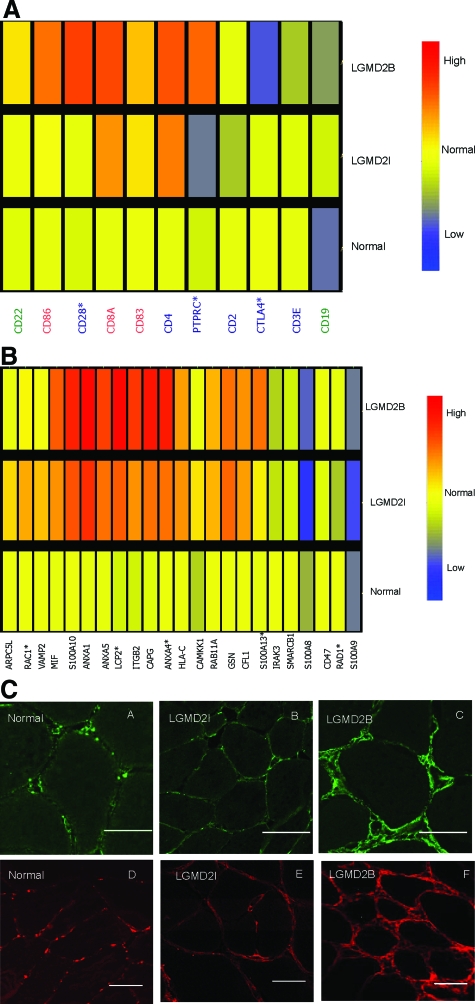
Figure 5.
Inflammation Related Transcripts in Muscle. A: Shows candidate mRNA markers for T cells (blue font), B cells (green), and dendritic cells (red) queried against the muscle biopsy mRNA profiling data set, showing average expression levels for each group. Two T cell activation markers were increased in dysferlin deficiency (*P < 0.05) relative to FKRP dystrophy (CD28, PTPRC), and one T cell co-stimulatory suppression marker was decreased (CTLA4). This suggests an increase in the T cell costimulatory activity in LGMD2B muscle. B: Shows candidate mRNA markers for macrophages. Five transcripts were significantly altered in transcription (*P < 0.05), with four of these significantly increased in LGMD2B (LCP2, RAD1, ANXA4, and S100A13). C: Shows immunostaining for tenascin C (A, B, C) and versican (D, E, F) in muscle biopsies. Frozen sections were from normal control, FKRP [LGMD2I] (#F7), and dysferlin-deficient mutation positive patient (#D10). Tenascin-C is expressed at the plasma membrane, extracellular matrix, and blood vessels at a higher level in dysferlin-deficient muscle compared to FKRP biopsies. In normal muscle, tenascin-C shows low level patchy immunostaining at the plasma membrane. Confocal imaging of versican shown in normal control, LGMD2I and dysferlin deficient patients shows a pattern similar to tenascin-C, with increased staining in dysferlin-deficient muscle. Scale bar, 50 μm.

