
FIG. 4.
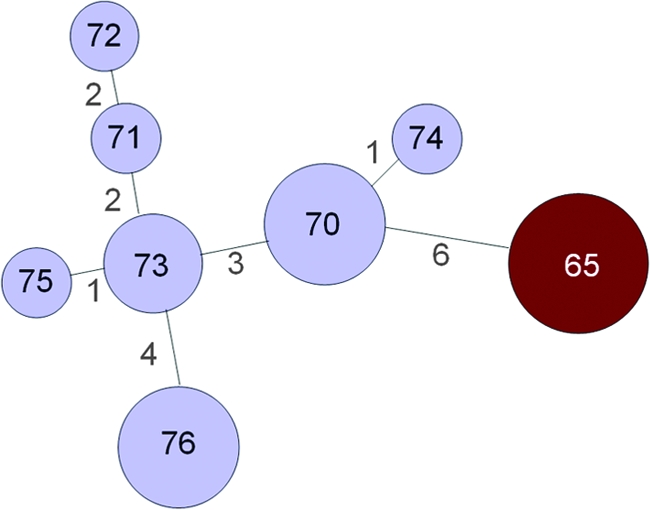
Minimum spanning tree analysis of STs of H. aegyptius isolates from Brazil. Lines between the circles are proportional to the number of locus differences, which are indicated by the numbers between circles. Circle sizes are proportional to the number of isolates with each ST. Numbers in circles represent the STs. Sources of information about the isolates are http://haemophilus.mlst.net/ (references 1 and 11); also see text and Table 7. BPF clone isolates are shown in red; all other H. aegyptius isolates are shown in light blue.