
Figure 1.
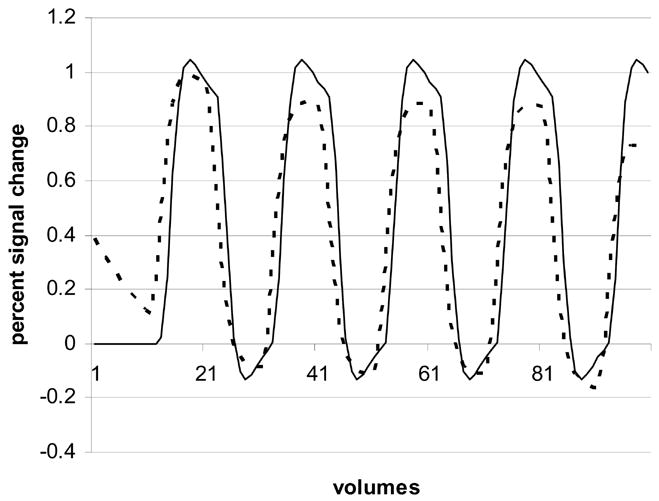
Comparison of task regressors used in the GLM. The solid line represents the regressor used in SPM2, AFNI, and BV, as well as the time course used to add simulated activation in the phantoms. The dashed line represents the regressor created by using the defaults in FSL for the 10 off/10 on block design.