
Figure 2.
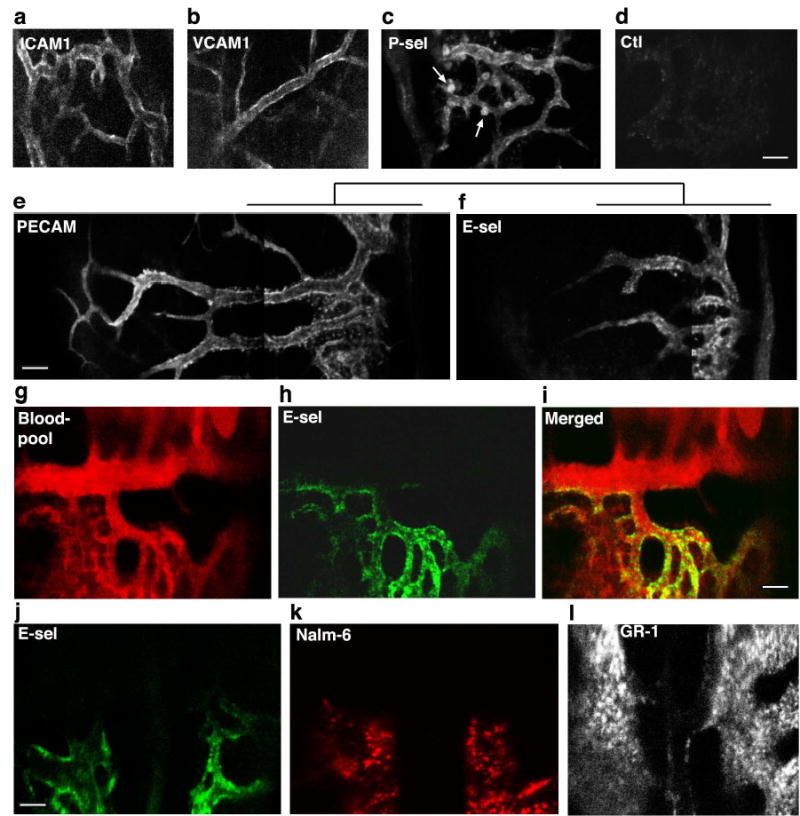
In vivo immunofluorescence microscopy of vascular CAM expression in BM. a–c. Representative images of ICAM-1 (area 6), VCAM-1 (area 8) and P-selectin (area 4). Each are expressed throughout the BM vasculature. Arrows indicate P-selectin+ megakaryocytes. d. Isotype control. e–f. Montage images of extended PECAM-1 expression vs. restricted E-selectin expression (both area 3). g–i. In this image series from area 4/6, the BM blood pool (red) is delineated by a non-specific fluorescent antibody signal. E-selectin expression (green) is restricted to one wall of a large collecting vein and to sinusoidal microvasculature in area 4. j–l. Correspondence of E-selectin expression (green) with Nalm-6 (red) homing patterns. This is contrasted with anti-GR1 (myeloid differentiation antigen) staining of the same region (midline, intersection of areas 3–6). Scale bars = 100 μm.