
Figure 2.
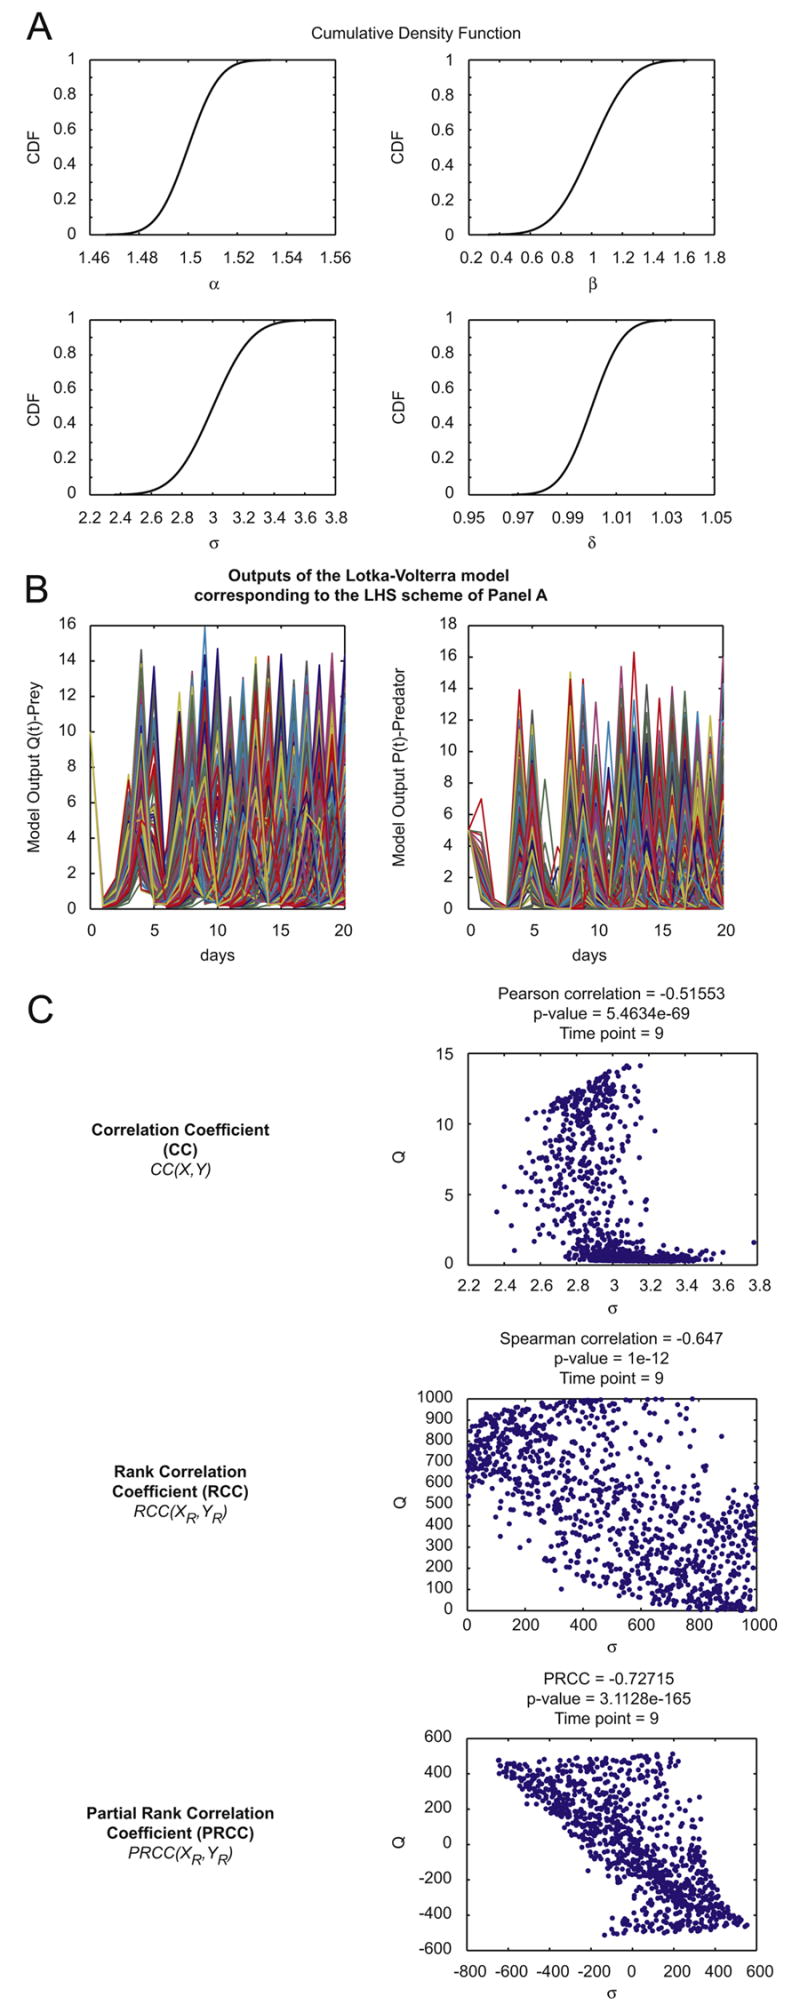
general LHS scheme and PRCC performed on the Lotka-Volterra model (model equations and parameters are as described in Section 3.1).
Panel A: Cumulative Distribution Functions – CDFs of 1000 samples independently drawn from normal pdfs (initialized following eqns. (3)) for the four parameters (α, β, σ, δ) of the Lotka-Volterra model described in Section 3.1, equations (1)-(2).
Panel B: outputs of the Lotka-Volterra model over time (days) corresponding to the parameter combinations of the LHS scheme illustrated in Panel A.
Panel C: Example of sampling-based correlation indexes calculated on the LHS matrix resulting from Panel A and from the output matrix resulting from Panel B. The reference output is the variable Q(t)-prey at time t=9 and it is shown on the ordinate. Parameter σ is taken as the parameter of interest and it is represented on the abscissa. Each dot represents the output value Q(9) for a specific sampled value of parameter σ.
Note that at each step of processing (correlation, rank correlation, partial rank correlation), the linear relationship between parameter and output variations becomes more apparent.