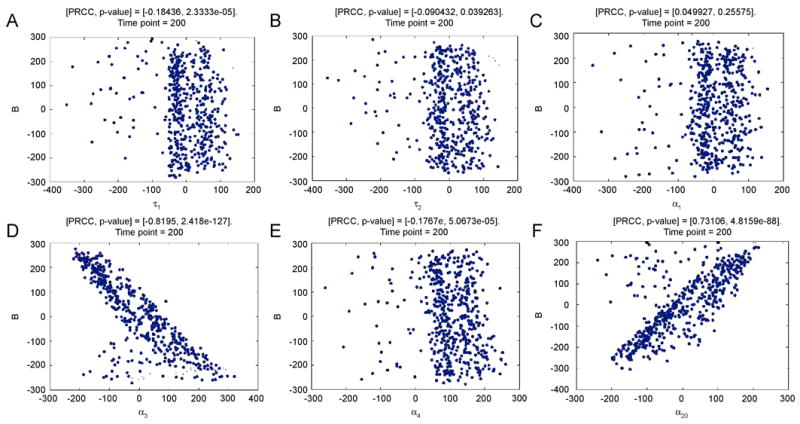
Figure 7.

PRCC scatter plots of parameters τ1, τ2, α1 α3, α4 and α20 (calculated at day 200, all 8 parameters are varied simultaneously). Sample size N=1000. The abscissa represents the residuals of the linear regression between the rank-transformed values of the parameter under investigation versus the rank-transformed values of all the other parameters. The ordinate represents the residuals of the linear regression between the rank-transformed values of the output versus the rank-transformed values of all the parameter under investigation The title of each plot represents the PRCC value with the corresponding p-value (see Table G.2 at 200 days in Supplementary Material online)
