
Figure 3.
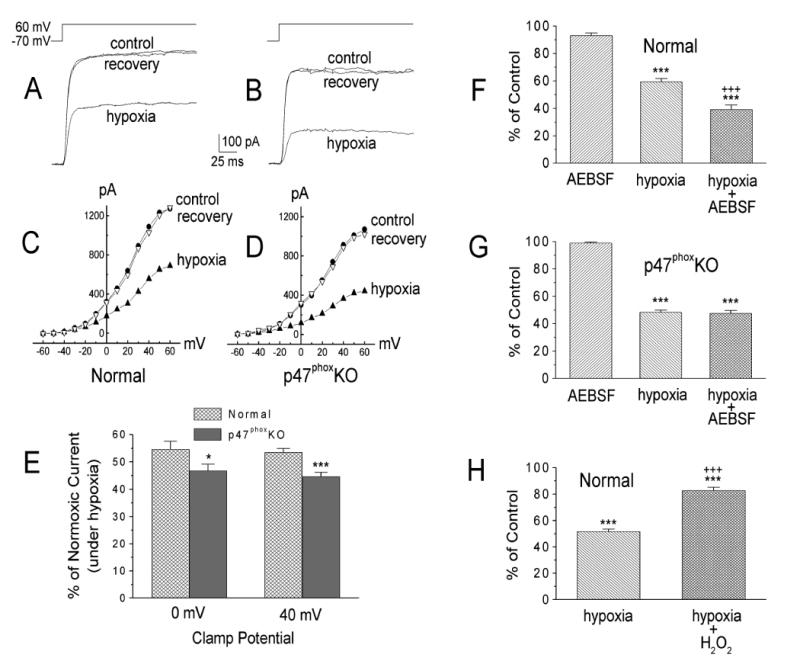
A and C: sample records (A) and current-voltage curves (C) obtained in a normal type I cell in normoxia, hypoxia, and again in normoxia (recovery). B and D: sample records (B) and current-voltage curves (D) obtained in a cell from a p47phoxKO mouse. E: mean hypoxic depression of the normoxic voltage-dependent K+ current (IK) at membrane potentials (Em) of 0 and +40 mV obtained in 31 normal and 32 p47phox KO cells. *P < 0.05; ***P< 0.001 vs. normal cells. F and G: effects of AEBSF (3 mM) in normal (n =10; F) and p47phox KO type I cells (n=12; G). ***P< 0.001 vs. AEBSF. +++, P< 0.001 vs. hypoxia. H: H2O2 (100μM) decreased hypoxic inhibition of IK in normal cells. Values are means± SE; n =12 cells. ***P< 0.001 vs. normoxia (100%). +++P < 0.001 vs. hypoxia. From (He et al., 2005) with permission.