
Figure 4.
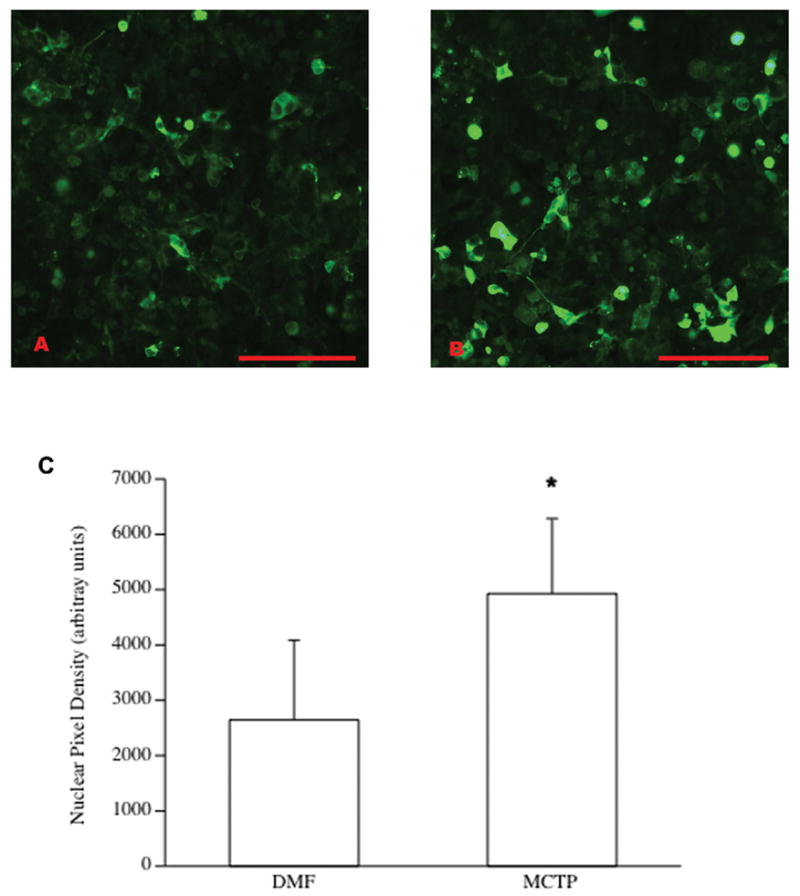
Translocation of transfected GFP-Smad 4 in HEK293H cells treated with 60μg/ml MCTP: A) Non-treated cells, and B) Cells treated for 1 hr. Bars = 50 μm. Images were converted to grey-scale, and qualitative analysis of nuclear translocation C) was based on pixel intensity, which was greater in MCTP-treated cells (* p<.05).