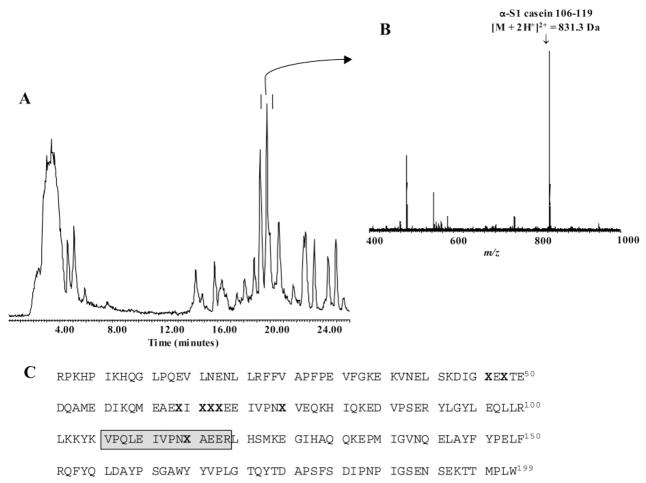
Figure 2.
LC ESI–TOF MS analysis of bovine α-S1 casein digest (23 μg, 1 nmol) after trypsin proteolysis (16 h, 37 °C). (A.) Total ion chromatogram of the α-S1 casein digest depicting the elution position of the doubly charged ion of the peptide α-S1 casein 106–119 (peak in double bar). (B.) Mass spectrum of the abundant ion of phosphopeptide α-S1 casein 106–119 (M+2H+)2+ of m/z = 831.3 identified in the α-S1 casein digest. (C.) Amino acid sequence of the phosphoprotein bovine α-S1 casein, and the location of its eight phosphoserine residues (X in bold). The phosphopeptide α-S1 casein 106–119, that contains a single phosphorylation site (i.e., phosphoserine 115), is shown in the gray-boxed area of the sequence.

