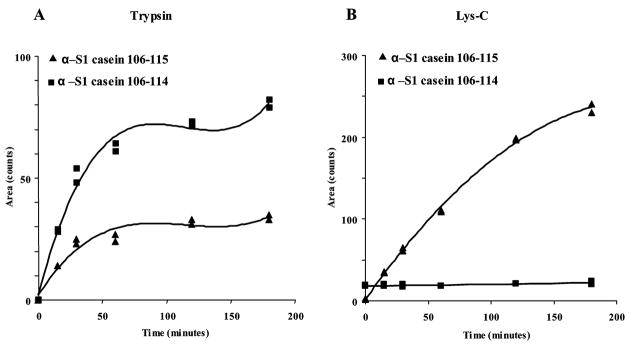
Figure 5.
Time course study demonstrating the appearance of peptide products after proteolysis of synthetic Aec-modified phosphopeptide α-S1 casein 106–119. (A.) Quantification of ion abundances of peptide α-S1 casein 106–115 (▲–▲) and peptide α-S1 casein 106–114 (■–■) after trypsin proteolysis (10 μg total, 37 °C) at sampling times of 0, 15, 30, 60, 120, and 180 min (duplicate samples). (B.) Quantification of ion abundances of peptide α-S1 casein 106–115 (▲–▲) and peptide α-S1 casein 106–114 (■–■) after proteolysis with endoproteinase Lys-C (5 μg total, 37 °C) at sampling times of 0, 15, 30, 60, 120, and 180 min (duplicate samples).

