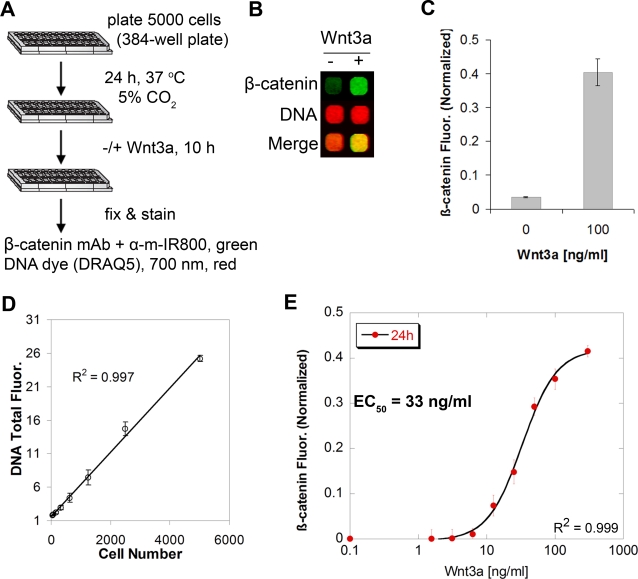
Figure 1. Description and validation of a quantitative method for temporal detection of cellular β-catenin.
(A) Schematic of the assay. m denotes mouse species. (B) A representative output infrared image of L-cells treated with or without Wnt3a (100 ng/ml) for 10 h. The image shows whole-cell fluorescence from actual wells of a 384-well plate, highlighting increase in β-catenin signal (green, 700 nm) without change in cellular DNA content (red, 800 nm, detected by DRAQ5). (C) Quantification of the β-catenin signal from (B). The signal is background subtracted and normalized to DNA fluorescence. Values represent the mean±SEM from quadruplicate experiments. (D) Linearity of measured DNA fluorescence (DRAQ5 signal) versus actual number of L-cells plated per well. (E) Dose titration of Wnt3a at 24 h illustrating half-maximal activation of cellular β-catenin in L-cells occurs at 33 ng/ml ligand.

