
Figure 5.
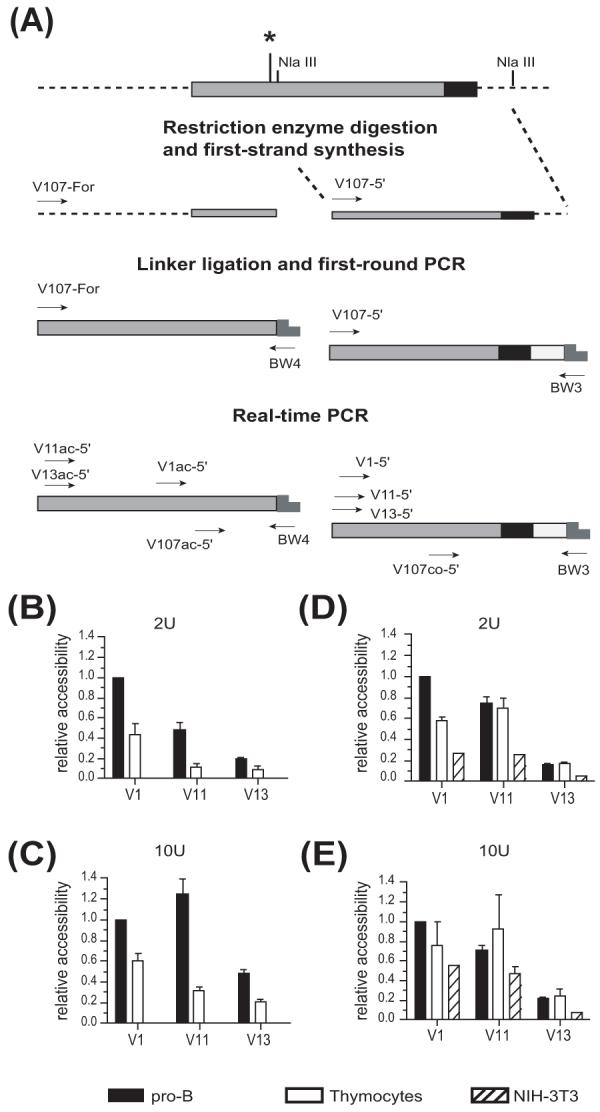
Chromatin accessibility correlates with rearrangement frequency. (A) Schematic representation of the VHS107 coding region (dark gray) showing the location of the RSS (black), the Nla III restriction enzyme sites, and the step by step strategy used to measure chromatin accessibility. Asterisk shows the location of the Pax5 binding site. Chromatin accessibility was assayed in the region flanking the Pax5 site at (B) 2 U, and (C) 10 U of enzyme in pro-B cells (CD19+), thymocytes and NIH-3T3 fibroblasts. Analysis of the chromatin accessibility surrounding the RSS was also performed at (D) 2 U and (E) 10 U of enzyme in pro-B cells (CD19+), thymocytes and NIH-3T3 fibroblasts. Data were obtained by real-time PCR, and are expressed relative to the accessibility of the V1 gene in pro-B cells (= 1). Results represent the mean ± SEM of 4 real-time PCRs from 2 independent preparations.