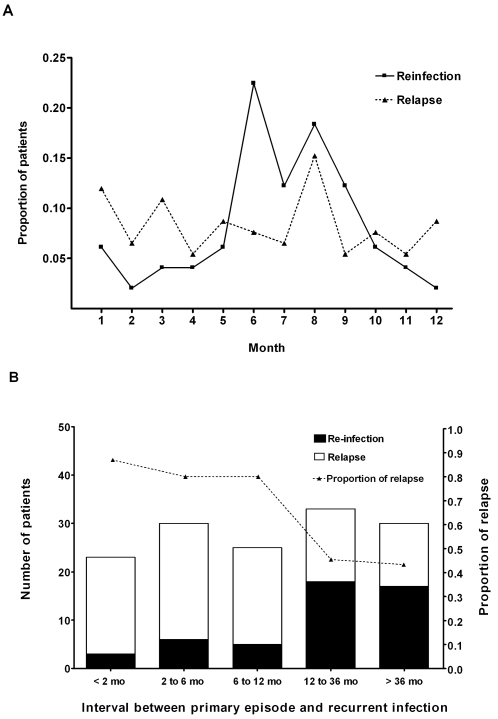
Figure 1. Comparison between patients with relapse and re-infection in relation to: (A) calendar month of presentation and (B) interval between primary episode and recurrent infection.
Dotted line in Figure 1B shows the proportion of patients with relapse presenting within each interval (right Y axis).

