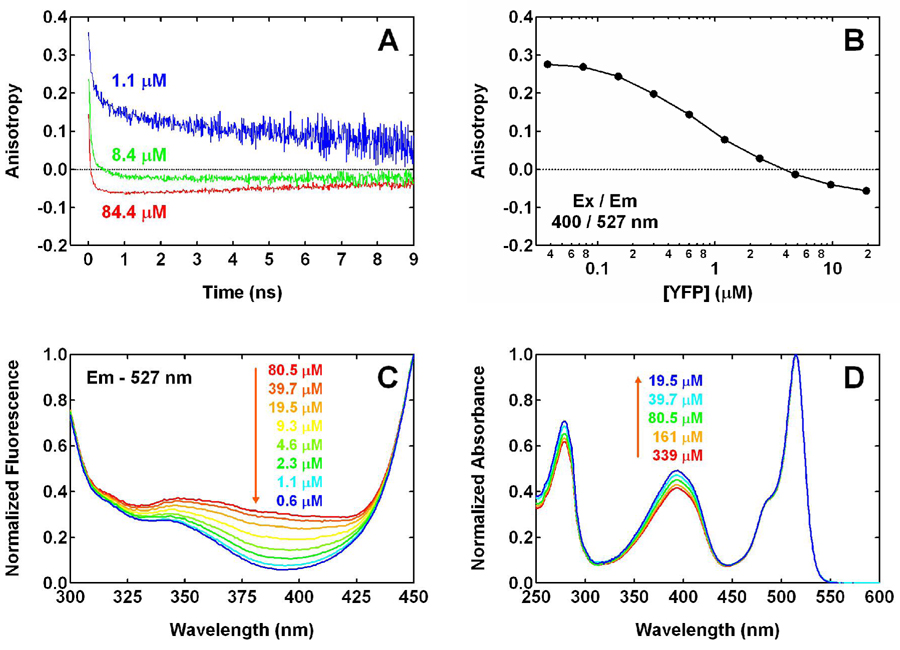
Figure 2.
(A) Time-resolved and (B) steady-state anisotropy of 527 nm fluorescence, measured for YFP 10C at pH 6.0 with 400 nm one-photon excitation. The protein concentrations, except the highest one in both panels, are calculated from the dilution factors. The error bars of steady-state anisotropy, calculated from the standard deviation of 5 measurements at each concentration, are smaller than the size of the markers in panel B and thus not shown. (C) Excitation (λem = 527 nm) and (D) absorption spectra of YFP 10C at pH 6.0 as a function of concentration, which are normalized to the intensity at 450 and 514 nm, respectively. The three lowest concentrations in panel C are calculated from the corresponding dilution factors.

