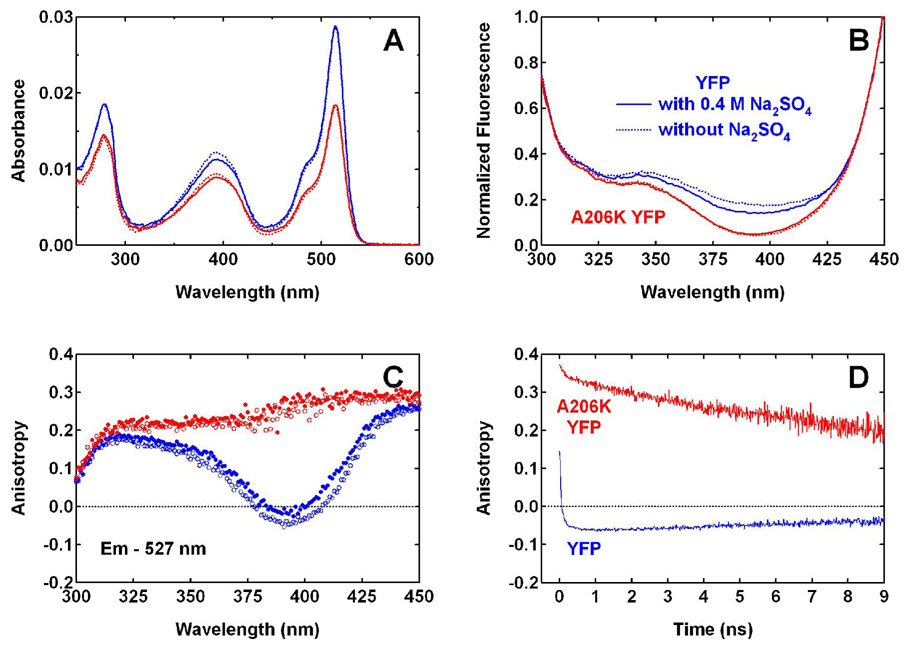
Figure 3.
(A) Absorption and (B) normalized excitation (λem = 527 nm) spectra of YFP 10C (blue) and A206K YFP (red) at pH 6.0. Dashed lines are spectra of proteins in normal pH 6.0 buffer (40 mM NaCl, 1 mM MgCl2, and 20 mM MES). Solid lines are spectra of proteins in pH 6.0 buffer with the components above plus 400 mM Na2SO4, added to increase the ionic strength. (C) The corresponding steady-state anisotropy for 527 nm fluorescence, with unfilled and filled circles representing the buffer conditions without and with 400 mM Na2SO4, respectively. (D) Time-resolved anisotropy measured for YFP and A206K YFP at 527 nm in normal pH 6.0 buffer with 400 nm one-photon excitation.

