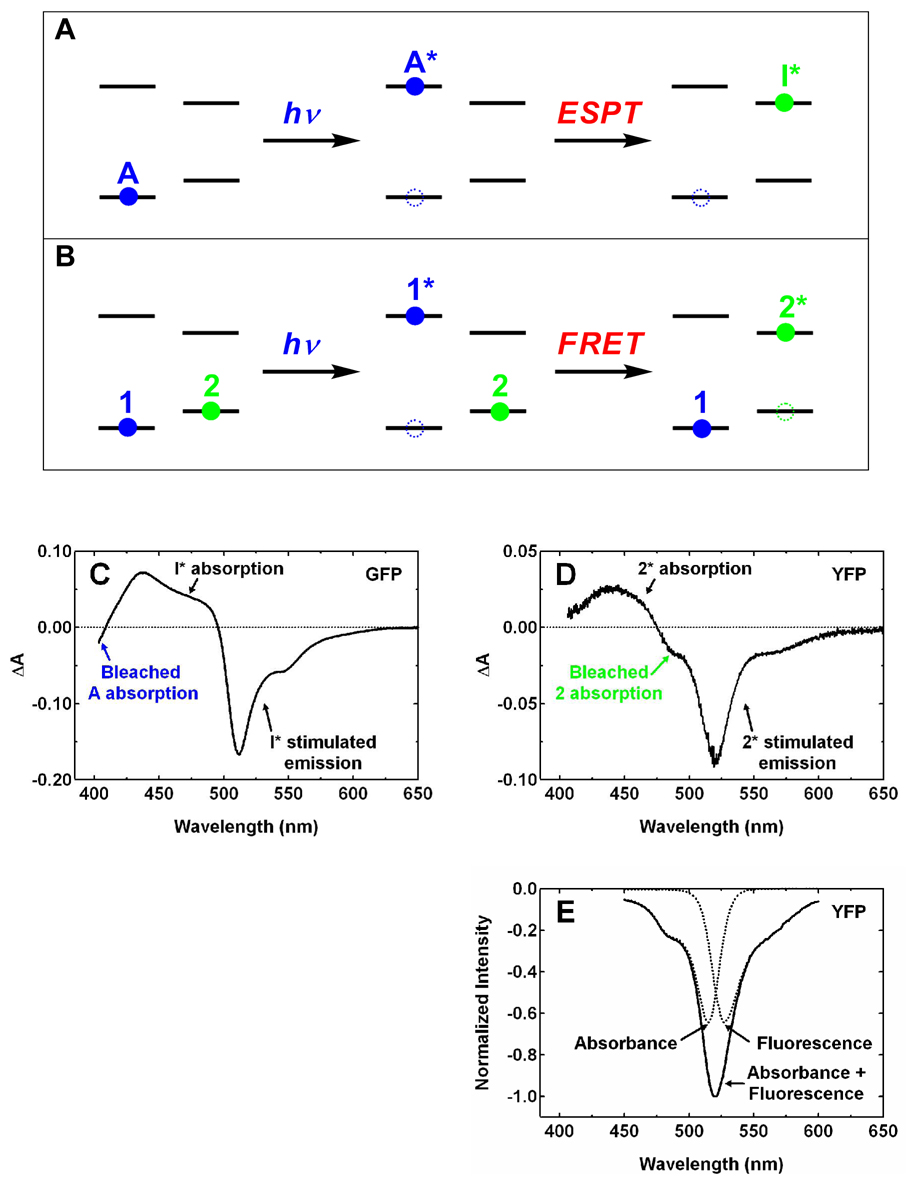
Figure 4.
Illustration of the states and processes involved in the excited-state proton transfer (A) and Förster resonance energy transfer (B). Blue and green circles represent neutral and anionic states, respectively. Filled and unfilled circles represent occupied states and transient absorption bleaches, respectively. Pump-probe spectra at ~ 450 ps following 390 nm femtosecond excitation pulses are shown for wild-type GFP at pH 7.8 (C) and YFP 10C at pH 6.0 (D), respectively. The band assignment for GFP by Kennis et al. (23) is followed in panel C. The spectra in C and D are consistent with the models shown in the rightmost panels of A and B, respectively. (E) Illustration of the contributions from the bleached absorption and stimulated emission of the anionic chromophore 2 to the transient absorption signal between 450 and 600 nm. Steady-state absorption and fluorescence spectra (see Fig. 1A) with equal peak intensity are inverted in sign to model these two contributions (dashed lines), respectively.

