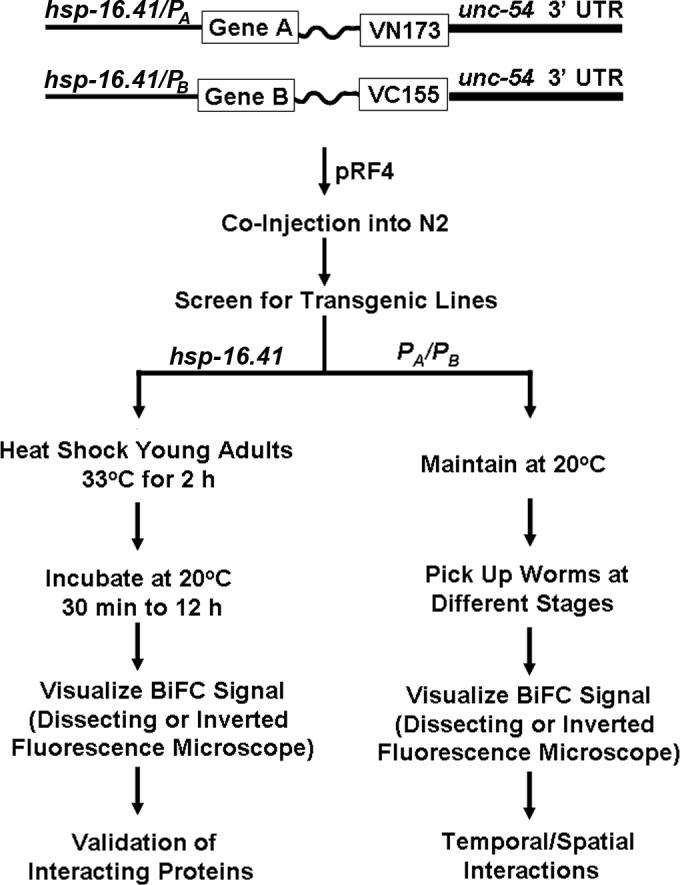
Figure 1. Strategies for BiFC analysis of protein interactions in C. elegans.

Shown is a flow chart for BiFC analysis of protein interactions in C. elegans. If the goal is to validate two interacting proteins in worms, use the hsp-16.41 promoter in both pCEBiFC-VN173 and pCE-BiFC-VC155 cloning vectors (22), and subclone the cDNAs encoding protein A and B into the multiple cloning site and follow the procedures on the left side to perform BiFC analysis. If the goal is to visualize temporal and spatial interactions, replace the heat shock promoter with gene specific promoters (PA and PB) and follow the procedures on the right side to perform BiFC analysis. Gene A or Gene B: cDNA encoding protein A or B. VN173: cDNA encoding residues 1−173 of Venus. VC155: cDNA encoding residues 155−238 of Venus.
