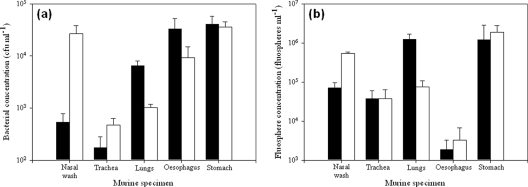
FIG. 5.
Deposition in the murine model of aerosols generated by the Collison nebulizer and the FFAG containing (a) E. coli MRE162 and (b) FluoSpheres. Black and white bars represent deposition of the Collison nebulizer and the FFAG, respectively. Distribution data are as follows: for distilled water, MMAD of 12.36 μm and GSD of 1.38; for E. coli, MMAD of 12.11 μm and GSD of 1.33; and for FluoSpheres, MMAD of 12.36 μm and GSD of 1.39. Particulates were sprayed at a concentration of 109 ml−1. Error bars represent the standard errors of the means (n = 10).

