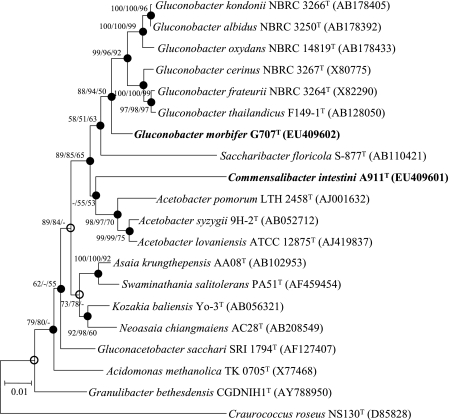
FIG. 1.
Neighbor-joining tree showing the phylogenetic positions of two novel strains and related species based on 16S rRNA gene sequences. Filled circles and open circles indicate generic branches that were also recovered using the minimum-evolution and maximum-parsimony algorithms and the minimum-evolution algorithm, respectively. Numbers at nodes indicate bootstrap values as calculated on the basis of neighbor-joining/minimum-evolution/maximum-parsimony probabilities expressed as percentages of 1,000 replications. Bootstrap values greater than 50% are shown at the branch points. Bar, 0.01 accumulated change per nucleotide.

