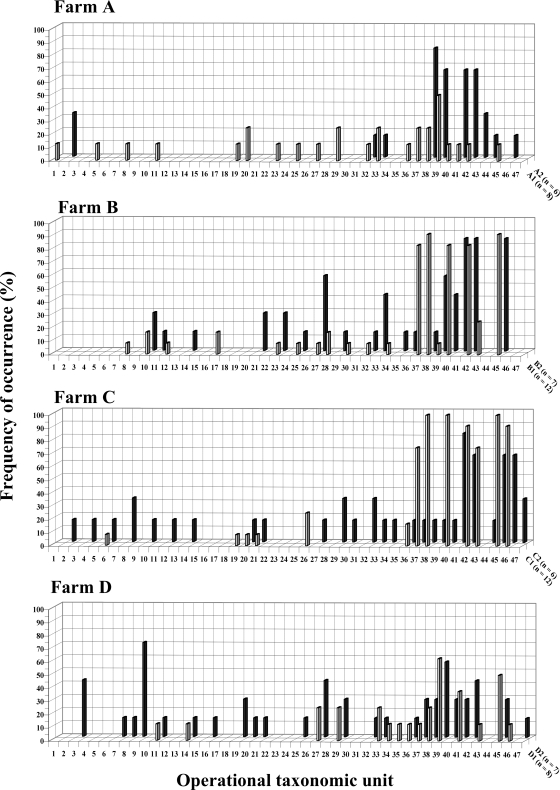
FIG. 2.
Farm-specific three-dimensional histograms showing frequency of occurrence (percent PCR-positive samples [z axis]) of each of the 47 OTUs (x axis) detected by PCR-DGGE in milk samples during the 2 years of sampling (y axis). The year number designation (1 or 2) is preceded by the farm designation (A, B, C, or D) and followed by the number of samples (n) in the corresponding category.

