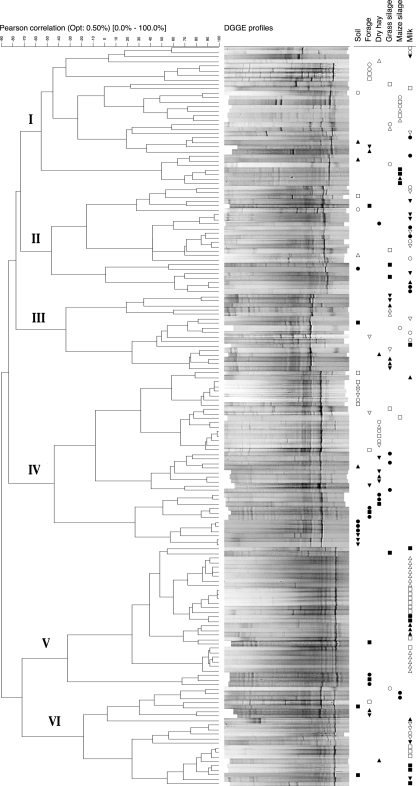
FIG. 3.
Cluster analysis of DGGE patterns obtained from the various dairy environments (soil, forage, grass silage, maize silage, dry hay, and raw milk), carried out using Pearson's coefficient and Ward's algorithm. The dendrogram illustrating the results of the analysis is presented on the left, with defined profile group numbers on the extreme left. Corresponding profiles are shown adjacent to their localization in the dendrogram. The origin of samples is indicated by a symbol: (○) farm A, year 1; (•) farm A, year 2; (□) farm B, year 1; (▪) farm B, year 2; (▵) farm C, year 1; (▴) farm C, year 2; (▿) farm D, year 1; (▾) farm D, year 2. Symbols are arranged according to sample type (top right).

