Figure 1.
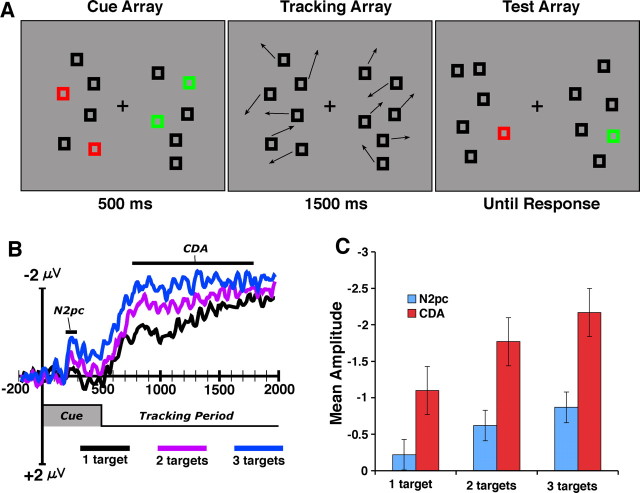
A, ERP multiple-object tracking task. Participants tracked either red or green boxes while maintaining central fixation. In each experiment, the number of total objects (including distractors) was held constant while the number of target boxes varied across trials. B, ERP difference waves (contralateral − ipsilateral) for experiment 1 from the average of posterior electrode sites (PO3/PO4; P3/P4; OL/OR; T5/T6). Negative voltage is plotted upward. Note that all ERP waveforms in this and subsequent figures reflect correct trial performance. C, Mean amplitude during the selection (200–300 ms) and tracking periods (800–1200 ms) as a function of the number of target items.

