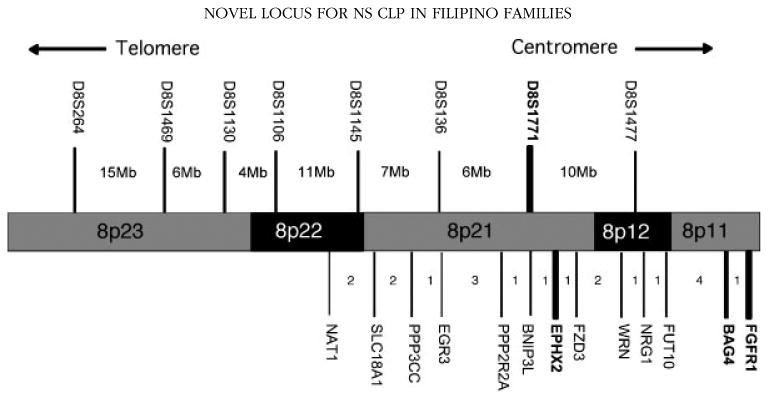
Fig. 2.

Map of 8p11-23. Above the chromosome are markers genotyped by the Center for Inherited Disease Research in the genome-wide linkage scan. D8S1771 (in bold) had the largest single-point LOD score and most significant NPL result. Below the chromosome are the SNP markers used for fine-mapping. In bold are those fine-mapping genes with the most significant FBAT P-values (FGFR1, BAG4, EPHX2). Distances in centimorgans between genes are shown in the intervals.
