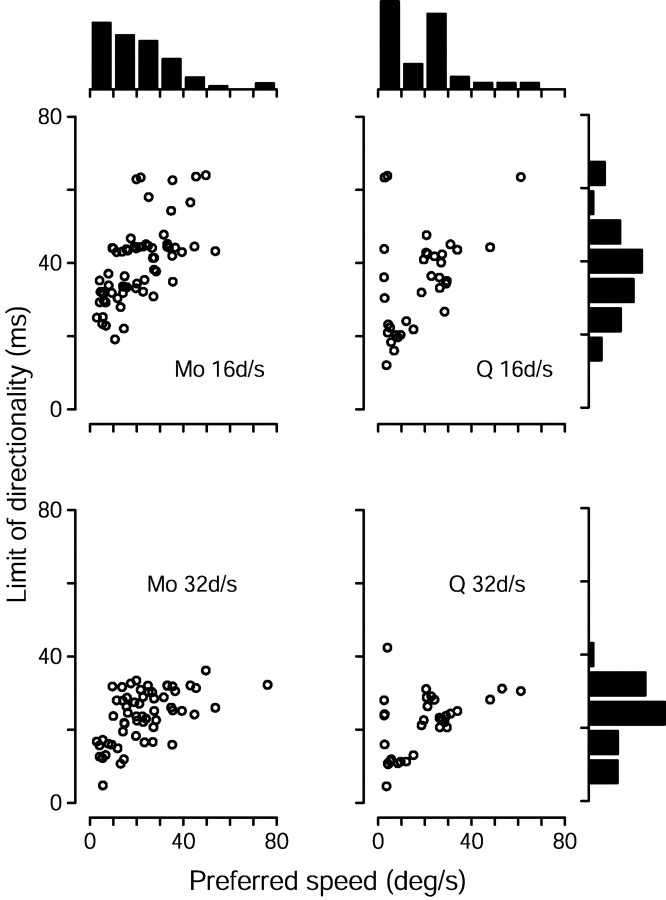
Fig. 5.
Scatterplots showing the relationship between preferred speed and the limit of directionality. Each symbol corresponds to one cell. The limit of directionality was calculated as the inflection point of sigmoidal fits such as that in Figure4B. Data are shown separately for monkey Mo (left column) and monkey Q (right column) and for stimulus speeds of 16°/sec (top row) and 32°/sec (bottom row). The histogram at thetop of each column shows the distribution of preferred speeds recorded from each monkey. The histograms on theright show distributions of the limit of directionality for each of the two stimulus speeds, collapsed across both monkeys (for whom they were similar but not identical). A small number of neurons, with high or low preferred speeds, had such weak directional responses to stimulus speeds of 16 and/or 32°/sec that their limit of directionality could not be calculated with any confidence. For the relevant stimulus speed, such neurons were excluded from the analysis shown in this figure, but are included in subsequent analyses.

