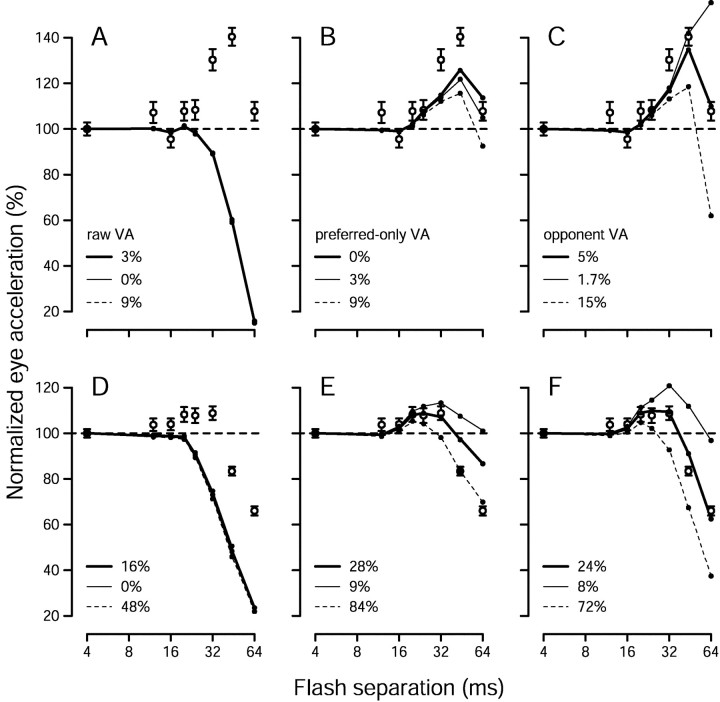
Fig. 8.
The influence of the parameter ɛon the behavior of the three vector average methods for estimating speed. All graphs plot pursuit data (open circles) and estimates of target speed (filled symbolsconnected by lines) for a stimulus speed of 16°/sec, derived and plotted as described in Figure 7. The three sets offilled symbols in each panel show estimates of speed created using different values of ɛ, as indicated by the keys. The top panels (A–C) each show data for monkey Mo (with the same pursuit data reproduced in each), and the bottom panels(D–F) show data for monkey Q. A,D, Estimates of speed were produced by the raw vector average. B, E, Estimates of speed were produced by preferred-only vector average. C,F, Estimates of speed were produced by opponent vector average.

