
Figure 1.
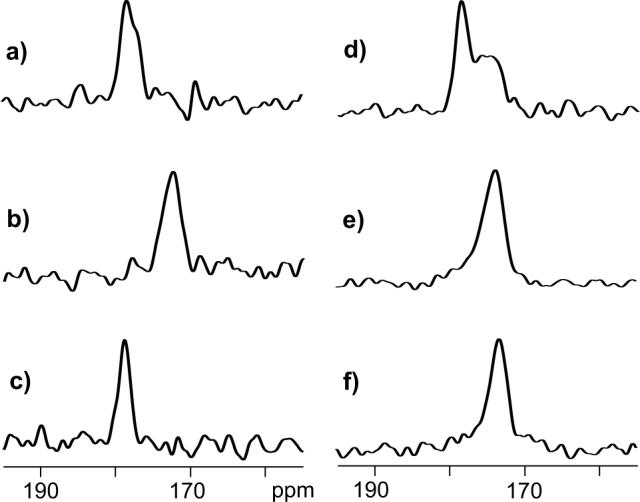
13C spectra of HFPtr-F8CL9N associated with (a) PC-PG and (b) LM3 membranes and of HFPtr-L7CF11N associated with (c, d) PC-PG, (e) LM3, and (f) LM3e membranes. The HFPtr:lipid mol ratio was ∼0.003 in the samples used to obtain spectra a and b and ∼0.007 in the samples used to obtain spectra c-f. Spectra a, b, and c are REDOR-filtered with τi = 1.0, 1.0, and 32.25 ms, respectively, and have 13CO peak chemical shifts of 178.4 (Phe-8), 172.5 (Phe-8), and 178.8 ppm (Leu-7), respectively. Spectra d, e, and f are REDOR S0 spectra with 32.25 ms dephasing period and have 13CO peak chemical shifts of 178.6 ppm, 173.8 ppm, and 173.4 ppm, respectively. Each spectrum was processed with 100 Hz Gaussian line broadening and baseline correction. The MAS frequency was 8000 Hz and the numbers of scans used to obtain spectra a, b, c, d, e, and f are 118784, 132864, 46048, 23024, 21760, and 98720, respectively.