
Figure 6.
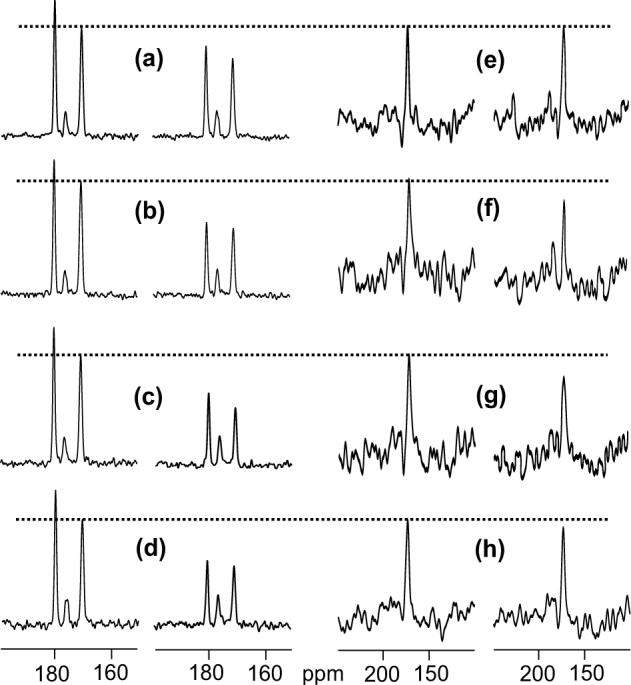
fpCTDQBU spectra of (a-d) the GFF sample and (e-h) the HFPtr-L7CF11N/LM3e sample. For each lettered pair of spectra, the S0 spectrum is on the left and the S1 spectrum is on the right. The MAS frequency = 8000 Hz, τR = 125 μs, the 13C π pulse rf field = 10 kHz, M = 336, and the total constant-time = (L + M + N) × τR = 84 ms. The values of L, N, and τi are: 128, 208, 32 ms (spectra a, e); 192, 144, 48 ms (spectra b, f); 256, 80, 64 ms (spectra c, g); 320, 16, 80 ms (spectra d, h). From left-to-right, each GFF spectrum has Phe-3, Phe-2 and Gly-1 13CO peaks at 180.3, 176.4, and 170.9 ppm, respectively. For each set of GFF and HFPtr spectra with the same τi, a dotted line is drawn at the peak S0 intensities of Gly-1 (GFF) and Leu-7 (HFPtr). The GFF spectra were processed with 50 Hz Gaussian line broadening, the HFPtr spectra were processed with 250 Hz Gaussian line broadening, and baseline correction was applied to all spectra. For some of the HFPtr spectra, there is a small glitch at ∼178 ppm which is due to DC offset in the data. The total numbers of scans used to obtain each spectrum in panels a, b, c, d, e, f, g, and h are 10240, 10240, 10240, 8192, 77056, 80736, 102432, and 152064, respectively.