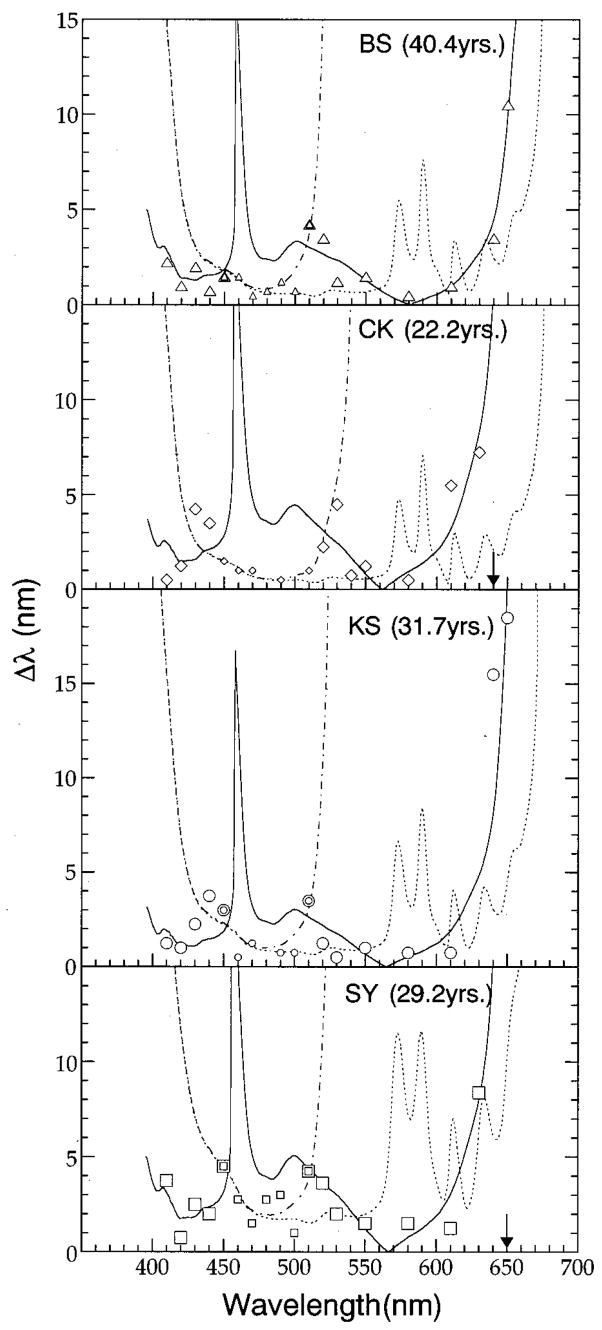
Fig. 1.
Wavelength discrimination thresholds (Δλ) plotted as a function of wavelength for four younger subjects. Smaller and larger symbols represent thresholds assumed to be mediated by an S-cone pathway and an L/M chromatically opponent pathway, respectively. Dashed–dotted and dotted curves represent thresholds calculated with Eq. (1) that incorporate or exclude, respectively, a noise parameter within an S-cone pathway. The solid curves represent thresholds calculated for the modeled L/M-cone pathway with Eqs. (3) and (4). Arrows correspond to standard wavelengths at which thresholds could not be determined.

