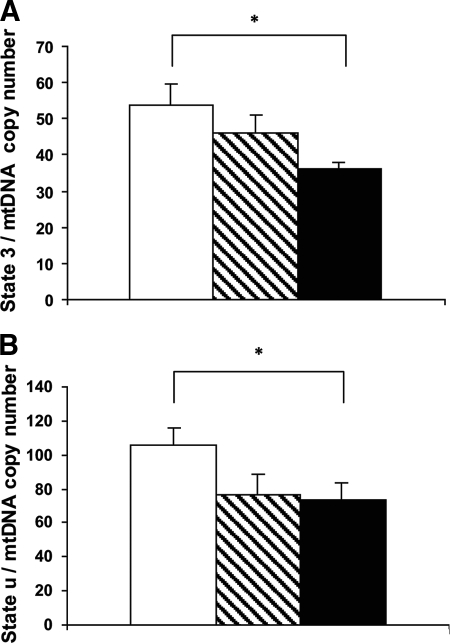
FIG. 3.
Ex vivo state 3 (A) and state u respiration (B) normalized for mitochondrial content expressed as pmol · (s · mg)−1 · mtDNA copy number−1 (×10.000) in control subjects, first-degree relatives, and diabetic patients. □, control; , FDR; ▪, type 2 diabetic patients. *P < 0.05 compared with diabetic patients.

