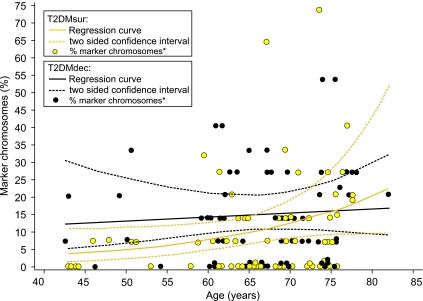
FIG. 6.
Regression curves and two-sided CIs of marker chromosomes in L-T2DMdec and L-T2DMsur. They were determined under a generalized linear model with log link function and negative binomial probability distribution. The x-axis gives the age of the donor, and the y-axis gives the number of marker chromosomes in percent. Each dot represents the number of marker chromosomes of one individual patient.

