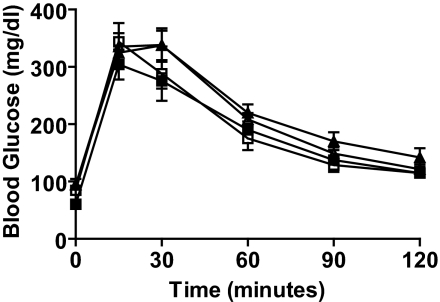
FIG. 3.
Glucose tolerance was maintained following 60% PPx. No significant differences in blood glucose levels were observed in either control or FoxM1Δpanc mice following PPx compared with sham at any time point during IPGTT. Error bars represent SE. Two-way ANOVA with Bonferroni's posttests was used to measure significance. n = 5–7 per group. □, control sham day 7; ▪, FoxM1Δpanc sham day 7; ▵, control PPx day 7; ▴, FoxM1Δpanc PPx day 7.

