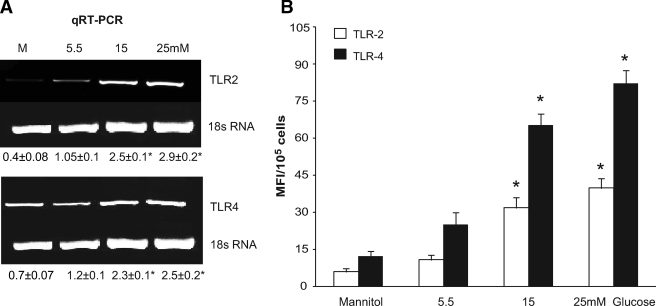
FIG. 1.
A: Representative RT-PCR gel of TLR2 and TLR4 mRNA expression in THP-1 cells after glucose challenge as described in research design and methods. Glucose (5.5 mmol/l) was added to mannitol control. Densitometric values are normalized to 18s rRNA and expressed as mean ratio ± SD. *P < 0.05 vs. mannitol or 5.5 mmol/l glucose; n = 6 experiments. B: TLR2 and TLR4 protein expression was measured in THP-1 after glucose challenge by flow cytometry as described in research design and methods. Glucose (5.5 mmol/l) was added to mannitol control. Values are expressed as MFI/105 cells ± SD. *P < 0.05 vs. mannitol or 5.5 mmol/l glucose; n = 6 experiments.

