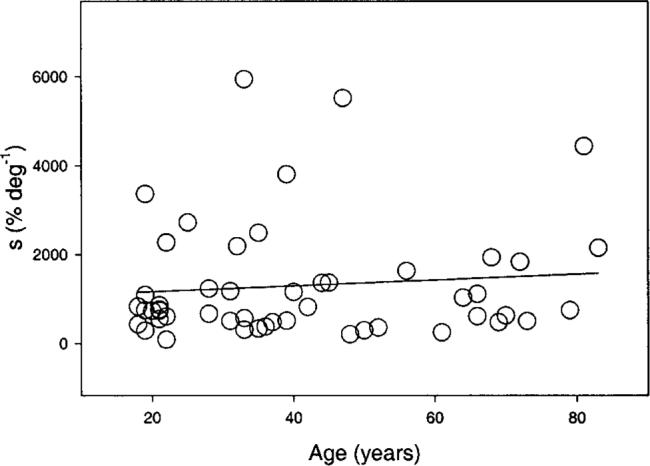
Fig. 6.

Data points correspond to the maximum slope of the Naka–Rushton modeling for a 505-nm test light presented at 6 deg temporal eccentricity. The solid line is based on a linear regression fit, which was not statistically significant.

Data points correspond to the maximum slope of the Naka–Rushton modeling for a 505-nm test light presented at 6 deg temporal eccentricity. The solid line is based on a linear regression fit, which was not statistically significant.