
Figure 5.
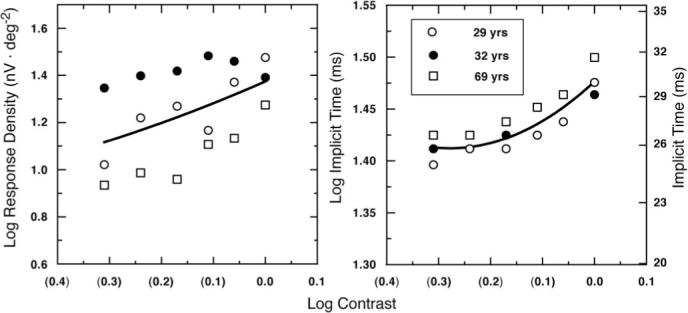
Log response density P1 – N1 and log implicit time P1 of the isolated flash response are plotted as a function of log stimulus contrast in the left and right panels, respectively. Data points represent the individual subject's responses synthesized for area 3 (15°−25°). The smooth curves represent best-fitting polynomials to the mean data: y(response density P1 – N1) = 0.612x2 − 1.426x + 1.779 (r = 0.98, P = 0.008), and y(implicit time P1) = 0.833x2 − 2.87x + 3.88 (r = 0.99, P = 0.003).