Figure 4.
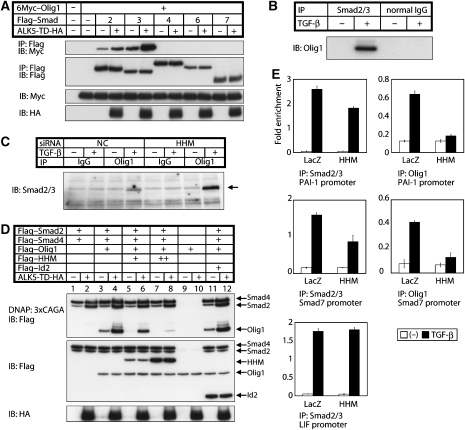
Olig1 is associated with Smad2/3, and their cooperative action on chromosome is abrogated by HHM. (A) TGF-β signalling-dependent association of Olig1 with Smad2 and Smad3. Physical interactions of Flag–Smads with 6Myc–Olig1 were examined by immunoprecipitation with anti-Flag antibody followed by immunoblotting with anti-Myc antibody in transfected HEK293T cells. TGF-β signalling was induced by ALK5-TD. (B) Physical interaction of endogenous Olig1 with endogenous Smad2 and Smad3 in U373MG cells. U373MG cells were treated with or without TGF-β (2.5 ng/ml) for 3 h before harvest. Cell lysates were subjected to immunoprecipitation with anti-Smad2/3 antibody, or normal mouse IgG as a negative control, followed by immunoblotting with anti-Olig1 antibody. (C) Stronger binding between endogenous Olig1 and Smad2/3 when HHM was knocked down. U373MG cells were transfected with control or HHM siRNA duplex and treated with or without TGF-β (2.5 ng/ml) for 3 h before harvest. Cell lysates were subjected to immunoprecipitation with anti-Olig1 antibody, or normal mouse IgG as a negative control, followed by immunoblotting with anti-Smad2/3 antibody. Smad3 is dominantly detected by this antibody in U373MG cells. (D) Interaction of Olig1 with the activated Smad complex bound to DNA is abrogated by HHM. HEK293T cells were transfected as indicated. Cell lysates were subjected to DNA-affinity precipitation assay using biotinylated 3 × CAGA as a probe. (E) Association of Olig1–Smad complex with the PAI-1 and Smad7 promoter regions is abrogated by HHM. ChIP analysis was performed using U373MG cells infected with Ad-LacZ or Ad-HHM. Cells were treated with TGF-β (2.5 ng/ml) for 1 h and harvested. Eluted DNAs were subjected to quantitative real-time PCR analysis. Values were normalized to the amount of the first intron of hypoxanthine phosphoribosyltransferase 1. Error bars represent s.d. Primer sequences are listed on the Supplementary Table S2.

