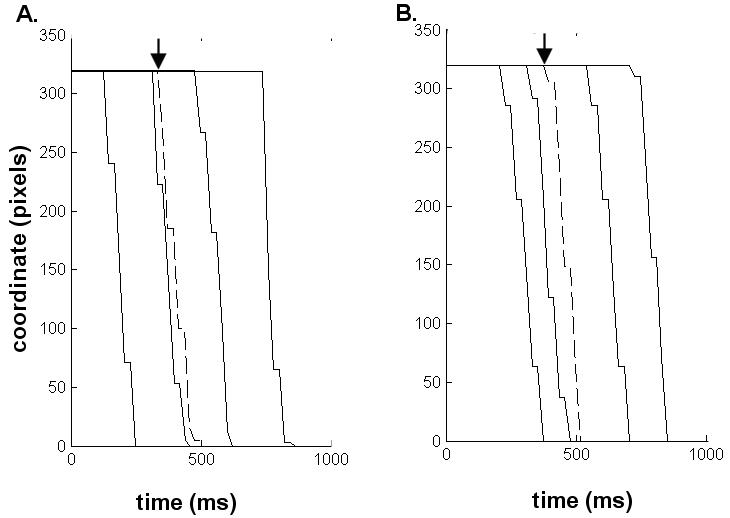
Figure 3. Sample trajectories from synchronous (dashed line) and asynchronous (continuous line) trials.

The plots show the cursor trajectory across the screen against time, with the asynchronous trials using cursor trajectories replayed from previous trials (see Methods). A: typical trials from subject IW. B: Typical trials from a control subject. The arrows indicate the onset of mouse movement.
