Figure 1.
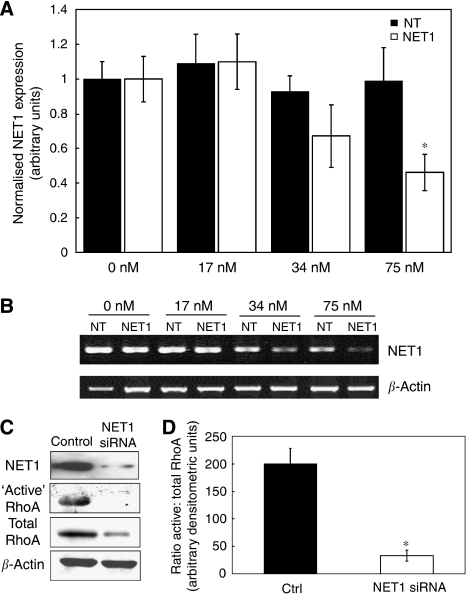
Decreased NET1 results in a reduction in the level of active RhoA. (A) Dose–response of NET1 mRNA expression to increasing levels of siRNA. Real-time PCR of NET1 mRNA expression in AGS cells following treatment with 0, 17, 34 or 75 nM non-target (NT) or NET1-specific siRNA in six-well format. (B) Agarose gel analysis of NET1 and β-actin PCR products in samples treated with or without increasing doses of NET1 or non-target (NT) siRNA. (C) Western blot analysis of control and RNAi-treated AGS cells. First panel: western immunoblot analysis of NET1 protein. Second and third panel: ‘active’ and total RhoA, respectively. Fourth panel: β-actin (loading control). (D) Ratio of active RhoA: total RhoA protein in control and NET1 siRNA samples, as determined using densitometric analysis. (*P<0.05). Error bars represent standard deviation of triplicate experiments.

