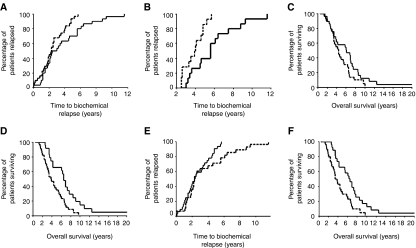
Figure 2.
(A) Shows a Kaplan–Meier plot for high (above the median, solid line) and low (below the median, dotted line) PTEN cytoplasmic expression and time to biochemical relapse (P=0.027). (B) Shows a Kaplan–Meier plot for high (above the median, solid line) and low (below the median, dotted line) PTEN cytoplasmic expression for patients that took longer than 30 months to relapse (P=0.0035). (C) shows a Kaplan–Meier plot for high (above the median, solid line) and low (below the median, dotted line) PTEN cytoplasmic expression and disease-specific survival (labelled overall survival; P=0.072). (D) Shows a Kaplan–Meier plot for patients with tumours that have membrane PTEN expression (solid line) compared to patients whose tumours do not have nuclear PTEN expression (dotted line) and disease-specific survival (labelled overall survival; P=0.002). (E) Shows a Kaplan–Meier plot for patients with tumours that have nuclear PTEN expression (dotted line) compared to patients whose tumours do not have nuclear PTEN expression (solid line) and time to biochemical relapse (P=0.078). (F) Shows a Kaplan–Meier plot for patients with tumours that have nuclear PTEN expression (solid line) compared to patients whose tumours do not have nuclear PTEN expression (dotted line) and disease-specific survival (labelled overall survival; P=0.003).

