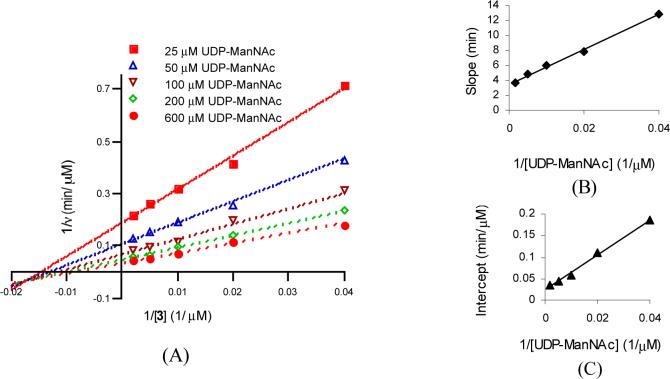
Figure 5.
(A) Double reciprocal plots of the initial velocity data with respect to 3 as the varied substrate. Initial velocities were measured at the indicated fixed UDP-ManNAc concentrations. Assays were carried out with [UDP-ManNAc] at 25−600 μM, [3] at 25−500 μM and 52 nM TagA. The data were fit to Equation 2. (B) Secondary plot of slope vs. 1/[UDP-ManNAc]. (C) Secondary plot of intercept vs. 1/[UDP-ManNAc].

