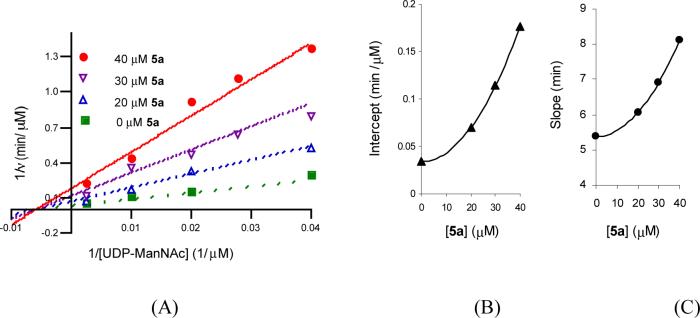
Figure 7.
(A) Product inhibition by lipid II analog 5a vs. UDP-ManNAc. Initial rates were measured at 52 nM TagA and 200 μM 3 in the presence of several fixed concentrations of lipid II analog 5a (0, 20, 30 and 40 μM) and varied UDP-ManNAc (25− 400 μM). The data were fit to Equation 5 for I-parabolic S-parabolic noncompetitive inhibition. (B) Secondary plot of intercept vs. [5a]. (C) Secondary plot of intercept slope vs. [5a].

