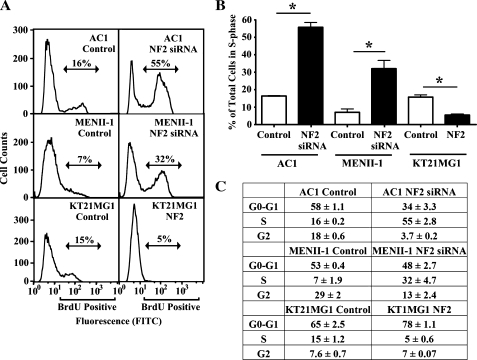
Figure 4.
Merlin loss enhances S-phase entry. AC1 and meningioma cell lines (MENII-1 and KT21MG1) were labeled with BrdU and 7-AAD to assess the cell cycle distribution of individual cells by flow cytometry. (A) Representative flow cytometric histograms indicate an increase in the percent of BrdU-positive cells in AC1-NF2-siRNA, MENII-1-NF2-siRNA, and KT21MG1-Control cells compared with AC1-Control, MENII-1-Control, and KT21MG1-NF2 cells, respectively. (B) Bar graphs depict the percentage of cells in the S-phase of the cell cycle (BrdU-positive cells) averaged from three independent experiments. Error bars correspond to ±SE. Asterisks denote statistical significance using unpaired t test (P <.05). (C) Table shows the mean of the percentage of cells ±SE in each phase of the cell cycle from three independent experiments.

