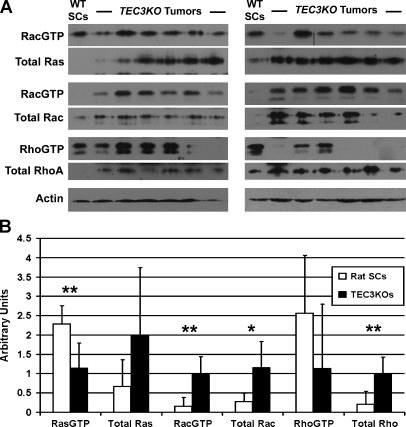
Figure 5.
Signaling analysis in TEC3KO tumors. (A) Representative blots from small G protein activity assays performed on 18 TEC3KO tumors. Samples were probed for the proteins indicated at left, and actin was used as a loading control. (B) Quantification of results from panel (A). Note the up-regulation of total forms of each protein; however, significant increases in activity levels were seen only with Rac1. *P < .05, **P < .01.

