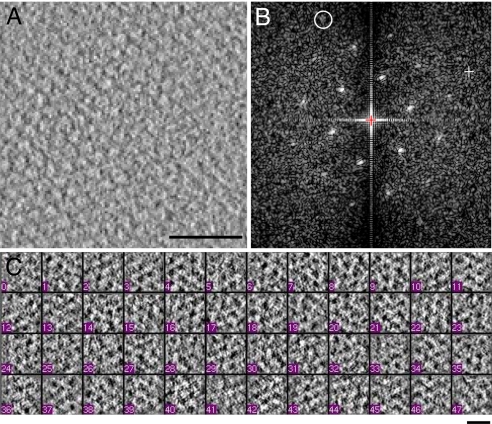
Fig. 2.
Cryo-electron tomographic analysis of crystalline Tsr assemblies. (A and B) A 4-nm-thick tomographic slice from a region of a reconstructed tomogram of whole cells containing receptor arrays, and its Fourier transform, respectively. The circled diffraction spot in B is at a resolution of ≈33 Å. (C) Representative examples of tomographic slices corresponding to local receptor clusters extracted from whole cell tomograms. [Scale bars: 50 nm (A) and 10 nm (C).]

