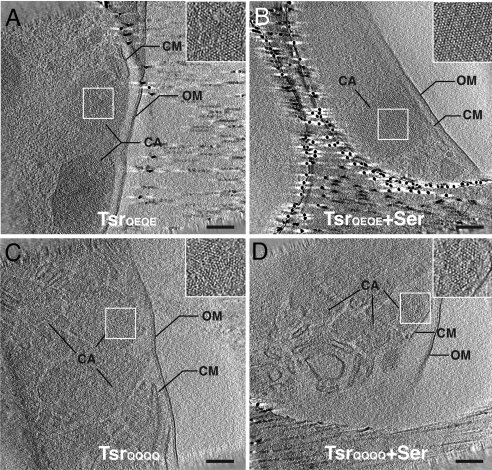
Fig. 3.
Cryo-electron tomography of Tsr chemoreceptor assemblies in whole E. coli cells. Shown are tomographic slices (≈10 nm thick) generated from E. coli cells engineered to overproduce TsrQEQE in the absence (A) or presence (B) of serine (Ser), and TsrQQQQ in the in the absence (C) or presence (D) of serine. Chemoreceptor assemblies (CA) are observed as crystalline patches embedded in cytoplasmic membrane (CM). The crystalline patches are observed throughout the cells and are contained by the outer membrane (OM); an expanded view of the patches is shown in the Inset to each panel. (Scale bars: 100 nm.)

