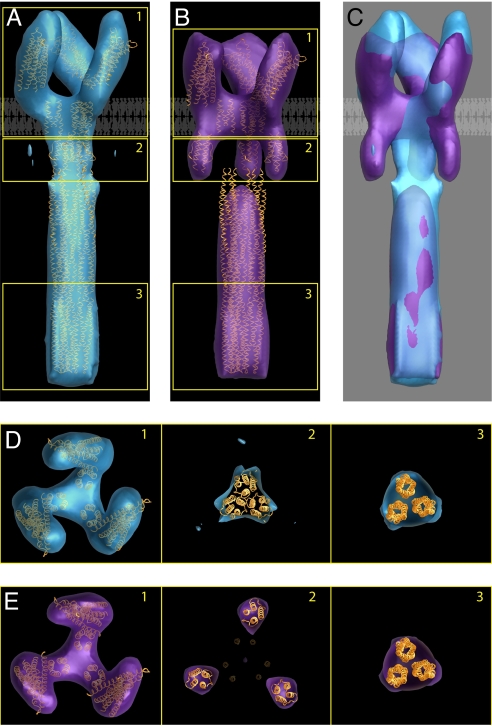
Fig. 4.
Identification of two trimeric Tsr conformations and interpretation of the density maps in terms of known structures of subdomains. Averaged density maps of TsrQEQE in both the compact (A) and expanded (B) conformations, with structural coordinates corresponding to chemoreceptor models fitted to a single trimer of receptor dimers. (C) Superposition of the two density maps highlighting overlap in the cytoplasmic domain and differences in the HAMP and periplasmic domains. A schematic view of the lipid bilayer is shown to highlight the locations of the putative transmembrane region in A–C. (D) Sections of the map from regions marked 1–3 in A correspond to the periplasmic domain, HAMP domain, and end of the cytoplasmic domain, respectively. Densities corresponding to each of these regions can be unambiguously assigned, although the map is not at a resolution where the rotational orientations of the individual domains can be determined. (E) Sections from the map shown in B displayed as described for D. The density in the cytoplasmic domain (section 3) was fit with a trimer obtained from three monomers derived from the structure of this region in the serine chemoreceptor Tsr reported by Kim et al. (11). Note that the packing of the trimer in our map is different from the organization of monomers reported in the crystals used to determine the structure (37) (PDB ID code 1QU7). Both conformations are interpreted by using the same packing arrangement in the cytoplasmic domain.

